

Asset Allocation: A Review of the Past 50 Years
Asset Allocation: A Review of the Past 50 Years
Jan 27, 2022 / By Craig L. Israelsen, PhD
It’s time for our annual review of asset allocation models and how they performed over the past 50 years in both accumulation mode and distribution modes.
In this review we will examine several asset allocation models and how they performed over the past 50 years (from January 1, 1972 to December 31, 2021) both in accumulation mode (preretirement) and distribution mode (during retirement).
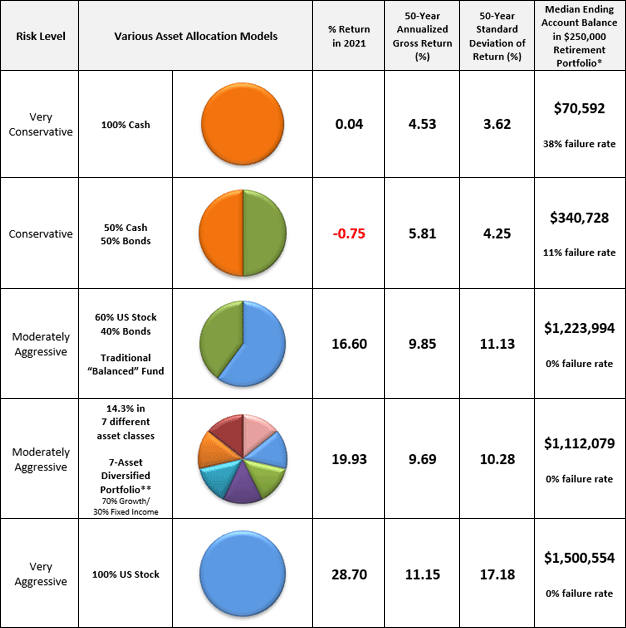
The first model is 100% cash (see Table 1). As cash is only one asset class, it does not represent an asset allocation model, which implies at least two asset classes. However, as many investors often hunker down in cash when they are afraid of the equities markets or worried about bonds, it’s worth examining the performance of cash over the past half century.
As can be seen in the table, cash produced a return of 0.04% in calendar year 2021. The 50-year average annualized return of a 100% cash investment was 4.53% (accumulation-mode performance) with a standard deviation of annual returns of 3.62%. It’s important to recognize that Table 1 is showing nominal returns that have not been adjusted for the impact of inflation (as measured by the Consumer Price Index).
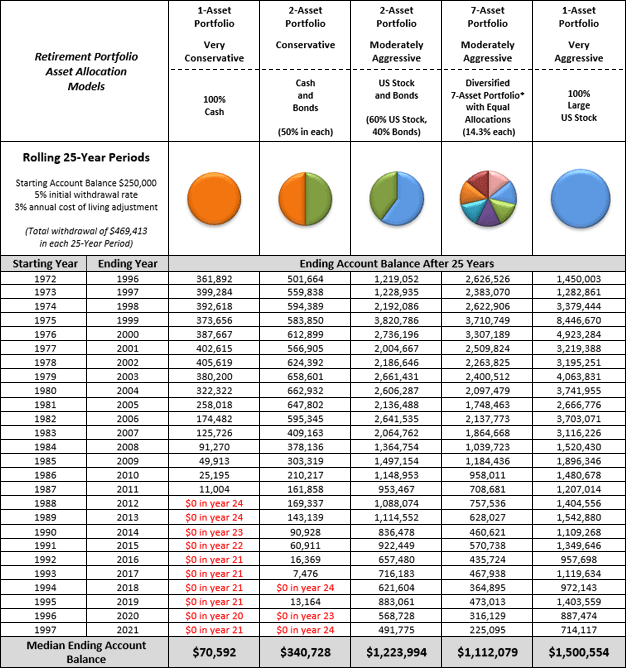
The last column in Table 1 shows the median ending account balance of a retirement portfolio. For an all-cash portfolio, the median ending account balance was $70,592 (distribution mode performance during retirement years). The median ending account balance was calculated over 26 rolling 25-year periods between 1972 and 2021, where the starting balance was assumed to be $250,000.
The initial withdrawal was 5% of the starting balance multiplied by a 3% cost of living increase—equalling a first-year withdrawal of $12,875. The second year withdrawal was 3% higher, or $13,261, and so on. The total withdrawal in each 25-year rolling period equaled $469,413. (See Table 2 for the results of each 25-year period).
It should be noted that the all-cash retirement portfolio had a 38% failure rate (see Table 2). That is, it failed to survive for the full 25 years during distribution mode in 38% of the rolling 25-year periods—all of the failures in recent periods.
We now move down the asset allocation food chain to a 50% cash/50% bond portfolio. This 50/50 portfolio represents actual asset allocation (that is, a model that uses more than one asset class)—albeit a very conservative model. The return of a 50% cash/50% bond portfolio in 2021 was -0.75%. The 50-year annualized return of a 50/50 portfolio was 5.81% and the median ending account balance after 25 years of withdrawals in a retirement portfolio was $340,728. This 50/50 bond/cash portfolio failed to survive for 25 years in distribution mode on three occasions (1994–2018, 1996–2020 and 1997–2021).
The next asset allocation model is a 60% large cap U.S. stock, 40% U.S. bond portfolio that is typically referred to as a “balanced fund.” The 60/40 portfolio gained 16.60% in 2021, and the 50-year annualized performance was an impressive 9.85%. The 50-year standard deviation of annual returns was 11.13%.
When any type of equity ingredient is added to a fixed income portfolio, the standard deviation will increase—often substantially. The 60/40 portfolio was rebalanced annually, as was the 50% cash/50% bond portfolio. The median ending account balance in a retirement portfolio that was sustaining annual withdrawals was $1.224 million. This outcome is quite remarkable in light of the fact that the retirement portfolio began each 25-year period with a starting balance of $250,000. However, as shown in Table 2, there was a high degree of variability in the ending account balance over the rolling 25-year distribution periods.
Next, we examine a multi-asset portfolio that included seven different asset classes in equal portions (14.29% each) that was rebalanced annually. The asset classes included large U.S. stock, small-cap U.S. stock, non-U.S. developed stock, real estate, commodities, U.S. bonds and cash. The indexes utilized to represent these asset classes are shown on the last page.
Table 1: 51-Year Asset Allocation Risk & Return Spectrum: 1972–2021Performance figures not adjusted for inflation
Source: Steele Systems Mutual Fund Software; calculations by Craig L. Israelsen.
Past performance does not guarantee future performance. The multi-asset portfolios were rebalanced at the start of each year.
The 7-asset portfolio gained 19.93% in 2021. Its 50-year average annualized nominal return was 9.69% with a standard deviation of annual returns of 10.28%—comparable performance with less volatility than the standard 60/40 asset allocation model. The median ending balance over 26 rolling 25-year withdrawal periods was $1.11 million.
Finally, we examine a 100% stock model. As with the 100% cash model, this does not represent an asset allocation model because it only includes one asset class. But since large-cap U.S. stock is a very prominent asset class, it is reviewed here. Large-cap U.S. stock (S&P 500 Index) gained 28.70% in 2021 with a 50-year average annualized return of 11.15%. The standard deviation was 17.18% and the median ending retirement account balance was $1.5 million. Impressive results, but a very aggressive approach in retirement.
Retirement is a time to stay diversified
The analysis of retirement portfolio survival in this article used an initial withdrawal rate of 5%. This particular rate was used for illustrative purposes and is not a suggested or recommended initial withdrawal rate for any particular retiree. An appropriate withdrawal rate is determined individually after considering a number of factors, including the amount of money in your retirement account, your age, needed income each year, anticipated number of years withdrawals may take place, anticipated annual rate of return of portfolio, anticipated general inflation rate in the overall economy, COLA being imposed, and so on.
Portfolio diversification should be a lifelong strategy—both before retirement as well as during retirement. Warning: diversification is not exciting. That’s by design. Broad diversification tends to smooth out returns, which is crucially important when you start withdrawing money from a portfolio—such as in retirement.
Why is it so crucial? Because the sequence-of-returns matters a great deal when money is being withdrawn from a portfolio. The scenario a retiree wants to avoid is one in which their portfolio suffers several annual losses just as they start pulling money out at the start of retirement. This would be a potentially disastrous sequence-of-returns risk which could materially reduce the longevity of their retirement portfolio.
Broad diversification does not eliminate sequence-of-returns risk, but it does significantly reduce it. And, for that reason, diversification should be a central tenet in a retiree’s investment philosophy.
Table 2: Retirement Portfolio Survival Analysis: 27 Rolling 25-Year Periods From 1972–2021$250,000 starting balance in each 25-year period5% initial end-of-year withdrawal with 3% annual COLAAnnual cost-of-living-adjustment applied at the end of each year starting with the first year
Source: Steele Systems Mutual Fund Software, calculations by Craig L. Israelsen
Past performance does not guarantee future performance. The multi-asset portfolios were rebalanced at the start of each year.
*7-asset portfolio consisted of large-cap US stock, small-cap US stock, non-US stock, real estate, commodities, US bonds and cash.
| Indexes Used in Calculation of 51-Year Performance (1972–2021) | |
| Portfolio Asset Class | Index Used to Represent Asset Class |
| Large US Stock | S&P 500 TR Index 1972–2021 |
| Small Cap US Stock | Ibbotson Small Stock Index 1972–1978 Russell 2000 TR Index 1979–2021 |
| Non-US Developed Stock | MSCI EAFE NR Index 1972–2021 |
| Real Estate | NAREIT Equity REIT Index 1972–1977 Dow Jones US Select REIT TR Index 1978–2021 |
| Commodities | S&P Goldman Sachs Commodity TR Index 1972–2021 |
| US Bonds | Ibbotson Intermediate-Term Government Bond Index 1972–1975 Barclays Capital US Aggregate Bond TR Index 1976–2021 |
| Cash | US TREASURY Stat US T-Bill 90 Day TR 1972–2021 |