

Keeping Up With Inflation in Retirement: Tradeoffs When Tapping the Portfolio
No single asset allocation is perfect for every retiree. The author examines six portfolios under two withdrawal methods—RMD or 4%—and evaluates the benefits and compromises inherent in each combo.
There is no single perfect asset allocation for a person in retirement. Each individual has unique circumstances, rules they may have to follow (think RMD), and specific goals for their retirement years. The question I’m asking here is this: Should a retiree’s asset allocation be affected by their individual circumstances?
The answer would seem to be obviously “ Yes.” But, as always, the devil is in the details. How would these individual circumstances translate into a customized asset allocation?
This article examines six different asset allocation models that could be utilized in retirement. The specific variable of interest is how the withdrawal method during retirement (RMD or 4% rule) can inform the asset allocation. Said differently, should the withdrawal method impact the asset allocation of the portfolio? This analysis also examines the inherent tradeoffs associated with one asset allocation versus another.
As shown in Table 1, the first portfolio is 100% equity. While not a prudent retirement portfolio, it may be considered by some retirees. In this scenario, the specific asset allocation is 60% large U.S. stock and 40% small U.S. stock. Not surprisingly, it had the highest median 25-year return of 10.57% based on actual index-based performance over 72 rolling 25-year periods from 1926–2021.
A clear tradeoff is that it produced positive annual returns only 68.8% of the time. That means nearly one-third of the time the retiree experienced a negative calendar year portfolio return. The upside of an all-equity portfolio is that RMD-based annual withdrawals kept pace with inflation 90.4% of the time (using actual CPI data for each year in each of the 72 rolling 25-year periods). If withdrawing 4% of the portfolio balance each year, the retiree’s withdrawals kept pace with inflation 73.6% of the time.
From what we collectively know about human behavior, an all-equity portfolio during retirement is not likely to be sustainable. The retiree will become nervous during equity market downturns and will probably bail out after a couple of bad years in a row. To make matters worse, the retiree may “go to cash” and miss some of the returns when the equity market rebounds.
Our next option is an 80/20 portfolio—80% equity and 20% fixed income. The median 25-year return fell to 9.61%. (The 25-year period represents the time frame from age 72–97 when money is being withdrawn from the portfolio). An 80/20 portfolio produced positive annual returns 69.8% of the time—a fractional improvement from an all-equity portfolio.
Interestingly, RMD-based withdrawals kept pace with inflation 90.9% of the time which was slightly higher than the all-equity portfolio. Withdrawals based on the “4% rule” kept pace with inflation 70.4% of the time, a slight reduction from the 100% stock portfolio. Relative to the all-equity portfolio, the 80/20 asset allocation is an attractive alternative, though the fact that it experienced negative annual returns 30% of the time may be a problem for actual (reactionary) human beings.
The classic 60/40 allocation is next. The median 25-year return was 8.22%—a respectable level of performance. It produced positive annual returns 75% of the time—a noteworthy improvement from the all-equity and 80/20 models. RMD-based withdrawals kept pace with inflation 89.7% of the time—completely acceptable. Withdrawals based on a 4% rate keep pace with inflation roughly 60% of the time—not so great.
The 60/40 is a classic example of tradeoffs. If the retiree is required to make RMD withdrawals and if keeping pace with inflation is important to them, the 60/40 asset allocation model is a great choice. However, if they are pulling money out using the 4% rule, an 80/20 portfolio will be a better option if keeping pace with inflation is important.
Table 1: Tradeoffs in Various Retirement Asset Allocation Models Analysis Period: 1926–2021Best result highlighted in yellow
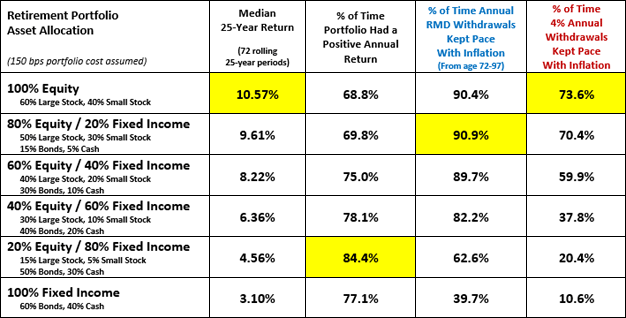
Source: Craig Israelsen
Large U.S. Stock was represented by the S&P 500 Index. Small-Cap U.S. Stock represented by Ibbotson Small Stock Index from 1926–1978 and the Russell 2000 Index from 1979–2021. U.S. Bonds represented by the Ibbotson Intermediate-Term Government Bond Index from 1926–1975 and the Bloomberg Barclays Capital U.S. Aggregate Bond Index from 1976–2021. Cash represented by 90-day U.S. Treasury Bill.
Let’s jump to the 20% equity/80% fixed income portfolio. This is the best choice if the retiree wants to see positive annual returns in their portfolio more often. This model had positive annual returns 84.4% of the time. But the retiree had to live with RMD withdrawals that only kept pace with inflation 62.6% of the time or 4% annual withdrawals that kept pace with inflation only 20.4% of the time.
Lastly, a 100% fixed income portfolio is clearly inadequate if keeping up with inflation is an important goal.
Lower bond returns in the future?
This 96-year analysis includes a number of years in which interest rates were in a general state of decline (from 1982–2021). As a result, from 1982–2021 the annualized return for the U.S. aggregate bond index was 7.42%. By contrast, from 1948–1981 (a period of rising interest rates) the bond index had an annualized return of 3.83%.
Should bond returns be lower in the future, retirement portfolios with higher allocations to fixed income will likely perform worse than illustrated in Table 1. For example, if we reduce the historical annual bond returns over this 96-year period by 300 bps, the 60/40 portfolio had a median rolling 25-year return of 7.32% or 90 bps lower than if using actual historical bond returns. With annual bond returns lower by 300 bps, the 60/40 portfolio had positive annual returns 71.9% of the time, down from 75% of the time. Withdrawals based on the RMD outpaced inflation 84% of the time, rather than 89.7% of the time. Annual withdrawals based on a 4% rate kept pace with inflation 50.7% of the time, down from 59.9% of the time.
Does the possibility of lower bond returns in the future rule out the 60/40 model as a retirement portfolio? Very simply, no. A decline in bond returns can often be offset by performance in other asset classes. For instance, if interest rates rise, cash returns will begin to regress toward their long-term average of 3.31%—partially offsetting lower bond returns. Or, a retiree may choose to adopt a slightly higher equity allocation, such as moving from a 60/40 model to a 65/35 model.
As always, the key is to remain diversified throughout our lifetime. Every asset class will take its turn being the hero and the goat (in the older sense of the word). Retirees with a diversified portfolio that includes a material allocation to equities and a behavioral commitment to stay invested through the occasional storms stand a very high chance of seeing their portfolio grow over time.
For example, a 60/40 portfolio with a starting balance of $1 million (using actual historical returns since 1926) had an average ending balance of $1.4 million after 25 years of RMD withdrawals and $2.8 million if 4% of the balance was withdrawn annually. If we reduce historical bond returns by 300 bps annually since 1926, the average ending balance after 25 years assuming RMD withdrawals was $1.1 million and $2.3 assuming 4% annual withdrawals. In short, a portfolio that generally follows a 60/40 asset allocation is durable and reasonably inflation resistant.
One clear implication of this analysis is that retirees wanting to have their annual withdrawals keep pace with inflation will need to have a higher equity allocation in their portfolio if they plan to only withdraw 4% annually. If they will be withdrawing money based on the RMD schedule, an equity allocation of 60% should be entirely adequate.